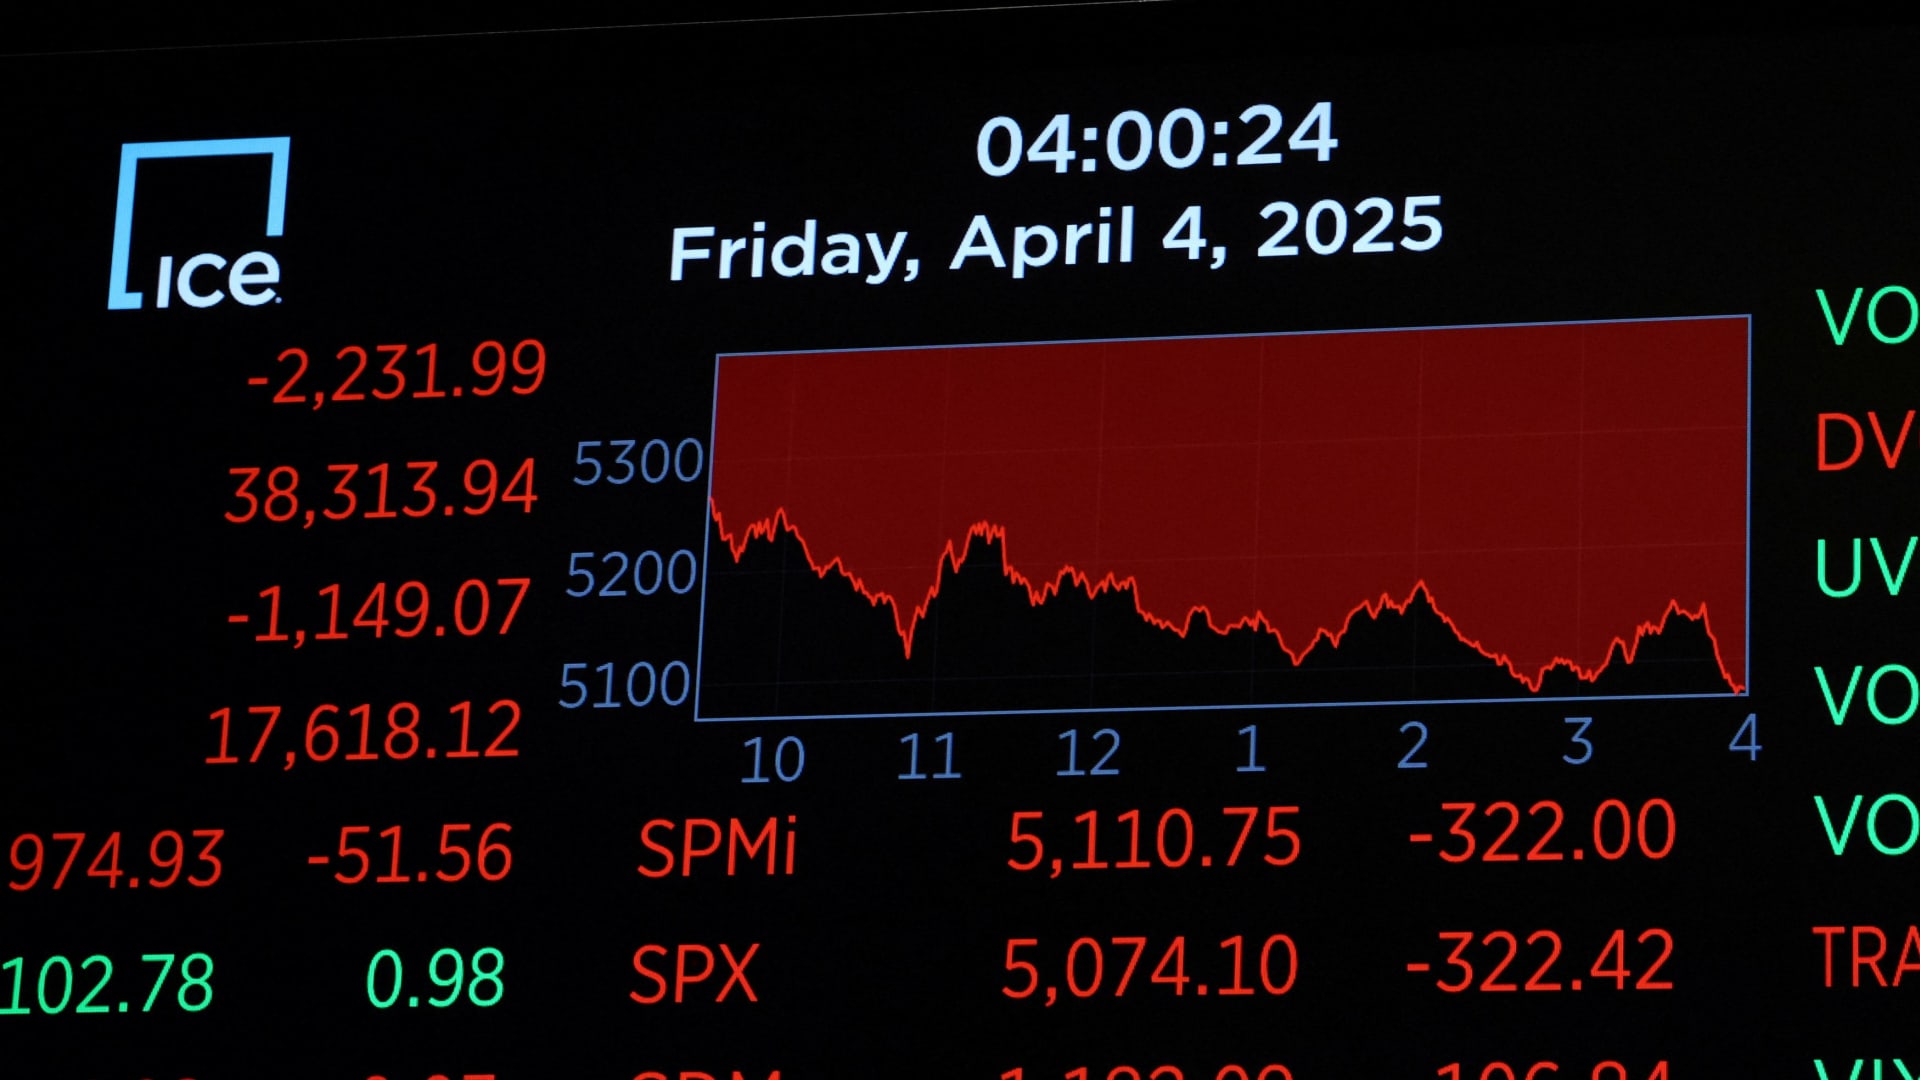
Financial markets that spent two years anticipating a recession that never came took two days to price in surging odds of a recession that might come by invitation. With one of the nastiest two-day selloffs in history following President Donald Trump’s launch of punitive tariffs on most trading partners, the stock market is in one of those precarious spots: Both tightly coiled for a near-term bounce soon, but not quite priced for the full fundamental implications of this policy as now contemplated. Bespoke Investment Group gave voice to this uncomfortable moment, in which markets that are built to produce the “wisdom of crowds” through rational, collective price-setting are lashed to the whims a president channeling decades’ worth of anti-trade feelings through the executive power to declare “emergency” tariffs. .SPX 5D mountain S & P 500, 5 days “We’d love to say that investors should watch a specific level or indicator for signs of a short-term low, but at this point, economic data doesn’t matter and the stock market is rudderless,” says Bespoke. “As Friday’s employment report showed, the economy had been holding up fine. The only thing that matters at this point rests on the decision of one man’s Truth Social account.” KKR head of global macro Henry McVey details the economic blow that would be struck by full implementation of tariffs as laid out by President Trump: “Given both the aforementioned breadth and depth of tariffs, growth will be dented more than we originally anticipated, with a mild U.S. recession risk now on the table in coming quarters. As context: the tariffs represent a U.S. fiscal tightening on the order of 2.5% of GDP, which — all else equal — could take the aggregate U.S. federal tax rate to the highest level this century.” There’s a line of argument that the tariff rates are so extreme, arrived at through mathematical means so willfully contorted, that they simply can’t stand unmodified. Longtime Wall Street economist and strategist Jim Paulsen of Paulsen Perspectives, late Friday on CNBC’s “Closing Bell Overtime,” hinted at such a reason to anticipate some kind of walk-back in the tariff package given the market response. Namely, that “the stupidity of what we’re doing becomes more obvious, if you will. The stupidity of enacting a massive tax increase on the entire global economy at this point doesn’t make much sense. And I think it doesn’t make much sense for the Fed to stubbornly not want to ease.” Federal Reserve Chair Jerome Powell on Friday reiterated that he sees “no hurry” to act on rates and noted again the risk of inflation expectations becoming stuck at elevated levels. This was taken by the market as a signal that truly severe trouble in the real economy or further extremes in capital-markets stress levels – in the form of credit spreads and other systemic indicators – would be needed to prompt a Fed rate cut. Certainly nothing to wish for. Historic collapse As for the market, however, much damage was done in a compressed sliver of time, perhaps an example of the market’s occasional penchant for “belated overreaction.” I had noted here and on TV in recent weeks that the S & P 500’s rally off a 10% correction in mid-March was a “plausible” bottom, if not a persuasive one. Repeatedly, the market tried to make something of several logical, if a bit neat-and-tidy, inflection points. After the decline to almost exactly 10% from the peak, just ahead of the supposedly strong late-March seasonal period with the CBOE Volatility Index rising right up against but not over 30, there was an exact closing last week of a gap from the prior week’s low. Each bounce failed. Even on Friday, during what would be a 6% cascade that finished right on the lows, traders tried to make the old August low just above 5,100 count before it finally buckled. .SPX 1Y mountain S & P 500, 1 year But ultimately, the week ended with a pretty good array of extremes in selling pressure and hedging demand of the sort that should turn the risk-reward more favorable for a reflex bounce before too long. NYSE volume was 93% skewed to the downside. A new record in put-option buying was set. The S & P 500’s relative-strength index hit a post-Covid low as the VIX hit a post-Covid closing high. The CNN Fear & Greed Index settled at 4 on its scale of 1 to 100. The 10% Thursday-Friday collapse in the S & P 500, taking it 17.4% below its Feb. 19 record high, ranks among the deepest two-day declines in more than 70 years: October 1987 (Black Monday), November 2008 (post-Lehman collapse) and March 2020 (the Covid crash). Not all were at an absolute low, but fierce rallies ensued soon afterward each time. After Friday’s wretched close, Jason Hunter, technical strategist at JP Morgan, offered some perspective on how bearish phases tend to unfold: “Even if the equity market has fallen into a recession-driven bear market, which seems like a reasonable mode of operation unless we see a sharp shift in the news flow, past bear markets didn’t often materialize in straight lines… We suspect the market can stage a bear market rebound from that support over the near-term, but believe that lift will be contained and potentially short-lived unless the news flow sees a dramatic change.” The market is so deep in the hole that the S & P 500 could rebound by 10% and merely touch its 20-day moving average, an area where snapback bounces in downtrends often fizzle. (This is where it’s important to note the paradoxical fact that deeply oversold markets in the midst of waterfall declines are both primed for ferocious bounces and at risk of disorderly further downside.) ‘Panic stage’ Not to macro-analyze a broadly brutal day, but it’s worth citing some interesting signs of surrender on Friday, the selling urgency striking some prior would-be safe havens while the sectors that led the decline got relative relief. Gold fell more than 2% Friday. Utilities sank 5.5%. Berkshire Hathaway shares lost almost 7% after a phenomenal run, with fellow “non-Mag7 quality mega-caps” Visa , Eli Lilly and JPMorgan all underperforming the S & P 500 on the day. The Russell 2000 – in a brutal bear market and not far above its 2018 high – outperformed the S & P 500 by 1.6 percentage points Friday. “We finally got to total panic stage here,” says Paulsen, who also notes some offsets to the radical drop in economic-growth prospects. Financial stimulus is on the way via the collapse in 10-year Treasury yields to 4% from 4.8% in mid-January. The falling US dollar has an easing effect, as does oil rushing down to $60 a barrel. And, of course, all the recession handicapping now hinges on the tariff aggression remaining in place, something that could change quickly if the administration opens an exit ramp. For as much severe price adjustment has occurred in seven weeks’ time, it’s hard to make the case that a wide margin of safety has been built into the market. Equity valuations have come in notably, albeit from elevated readings. The S & P 500 is back to 19.4-times 12-month forward earnings, which is high across the expanse of decades but believe it or not is a full P/E point below the five-year average. The equal-weighted S & P 500 P/E is back to its 15-year average under 16. It’s typical to mention that such multiples are only as good as the earnings forecasts, but the decline in the multiple is the market’s way of expressing some skepticism about the achievability of the numbers. So, the stock reactions to what stands to be a quarter of decent results but some downbeat guidance will tell us plenty about what sort of psychological cushion has been created by weeks of investor worry that seemed extreme until it proved too mild to absorb the shock of the Trump tariffs.


