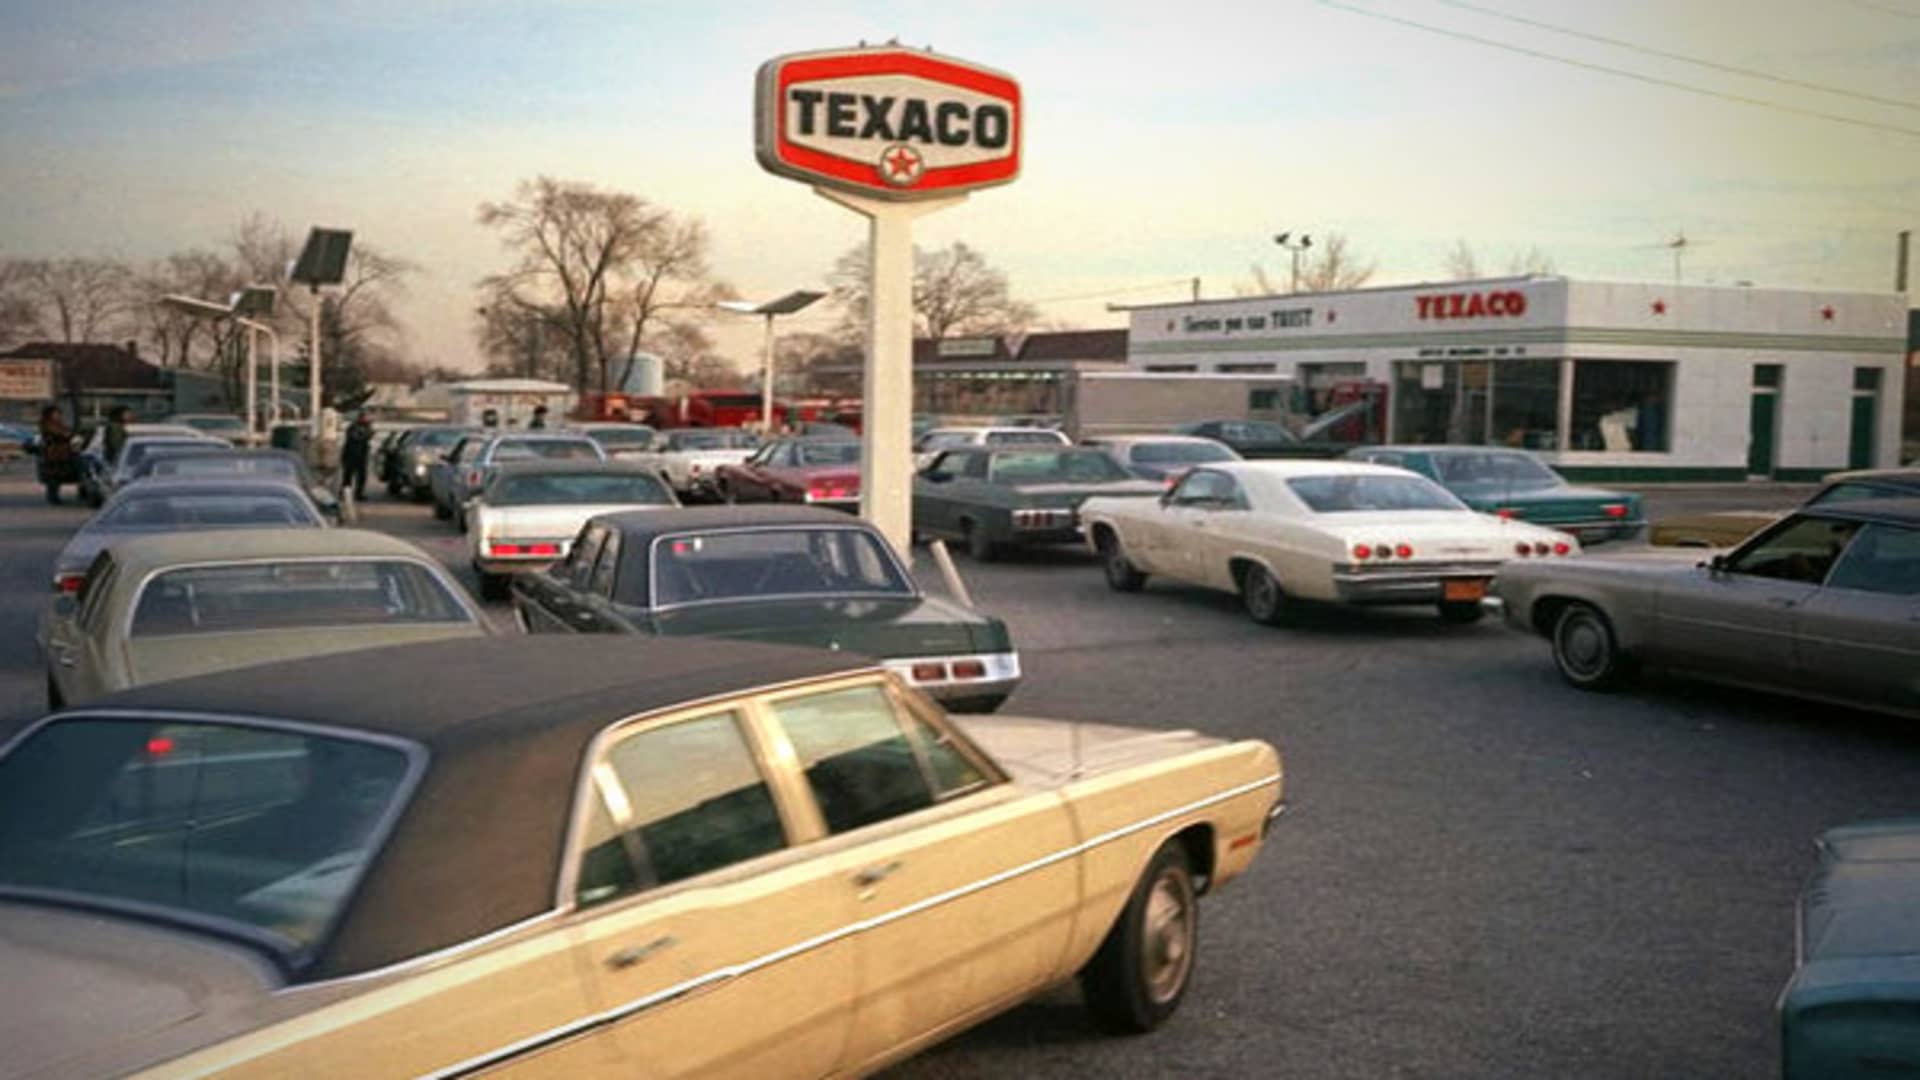
An inflation pattern is forming in the consumer price charts in the same way it did in the 1970s, a potentially troubling indicator for the financial markets. Investors should take a look at the shape of the Federal Reserve’s preferred inflation gauge today versus how it looked in the days of Presidents Nixon, Ford and Carter, according to Peter Corey, chief market strategist at Pave Finance. The core personal consumption expenditures price index, which excludes volatile food and energy prices, is currently chopping around 3%. After spiking toward 5.5% in the early days of the pandemic, it has thus far failed to get back to the Fed’s 2% annual rate. That’s eerily similar to the 1970s, when the same pattern resulted in a gruesome period for the stock market. Back then, inflation also ramped up past 5%, fell back toward 3%, but then ultimately soared above 10% between 1972 and 1974, hurt by the 1973 Arab Oil Embargo and the end of President Nixon’s wage and price controls . Stocks tumbled as a result, with the Nasdaq Composite plunging 31% in 1973 and plummeting another 35% in 1974. “There is an inflation pattern that is forming that is exactly the same as what happened in the 1970s, before the next big leg up in inflation,” Corey wrote to CNBC. Unique history To be sure, there are some big caveats to this idea. For starters, the big driver of inflation back then was the surge in oil prices. Today, crude prices could weaken in the fourth quarter as more supply comes online from OPEC+ member states . “Because the situation back then was different, it does not follow that inflation will automatically rise,” Corey said. But Corey believes there could still be a second bout of inflation in our own time. He pointed to other uncanny parallels between now and then, including threats to Federal Reserve independence that can push the central bank to lower interest rates just as inflation rears its head. Recent economic data has suggested a weakening labor market and inflation up a touch, but not so much as to crack the stock market. Longer term, though, the cost of energy might prove an eerie market killer this time around too. While virtually no one sees the cost of crude oil soaring as it did twice in the 1970s — once for the 1973 embargo and again in 1979 for the Iranian Revolution — the outlook for electricity prices today is less bright. Driven by soaring demand for power from artificial intelligence data centers, coupled with aging transmission and distribution infrastructure, electric prices have outpaced inflation since 2022 and are forecast to continue at that pace through at least 2026. Flying blind Unfortunately, however, the government shutdown means Wall Street is now flying blind when it comes to federal economic data. The stoppage in Washington since Oct. 1 already delayed the Oct. 3 nonfarm payroll report for September, and is likely to disrupt the release of September producer price numbers this Thursday and next week’s consumer price index, originally scheduled for Friday, Oct. 24, according to the Bureau of Labor Statistics. What matters for stocks is that any rise in inflation that compounds the elevated pricing pressures of the past several years is also likely to damage consumer sentiment, possibly dampening the spending that accounts for roughly two thirds of the economy while also lifting future price expectations that can become self-fulfilling, Corey said. “My base case is now that we should be finally starting to go into stagflation . That’s my base case,” Corey said, referring to the economic condition that marked the 1970s, when growth was sluggish and inflation stubbornly high. “Whether the stock market is going to agree with me for the next month, I don’t know, but at some point it’ll become evident.” — CNBC’s Gabriel Cortes contributed to this report.


