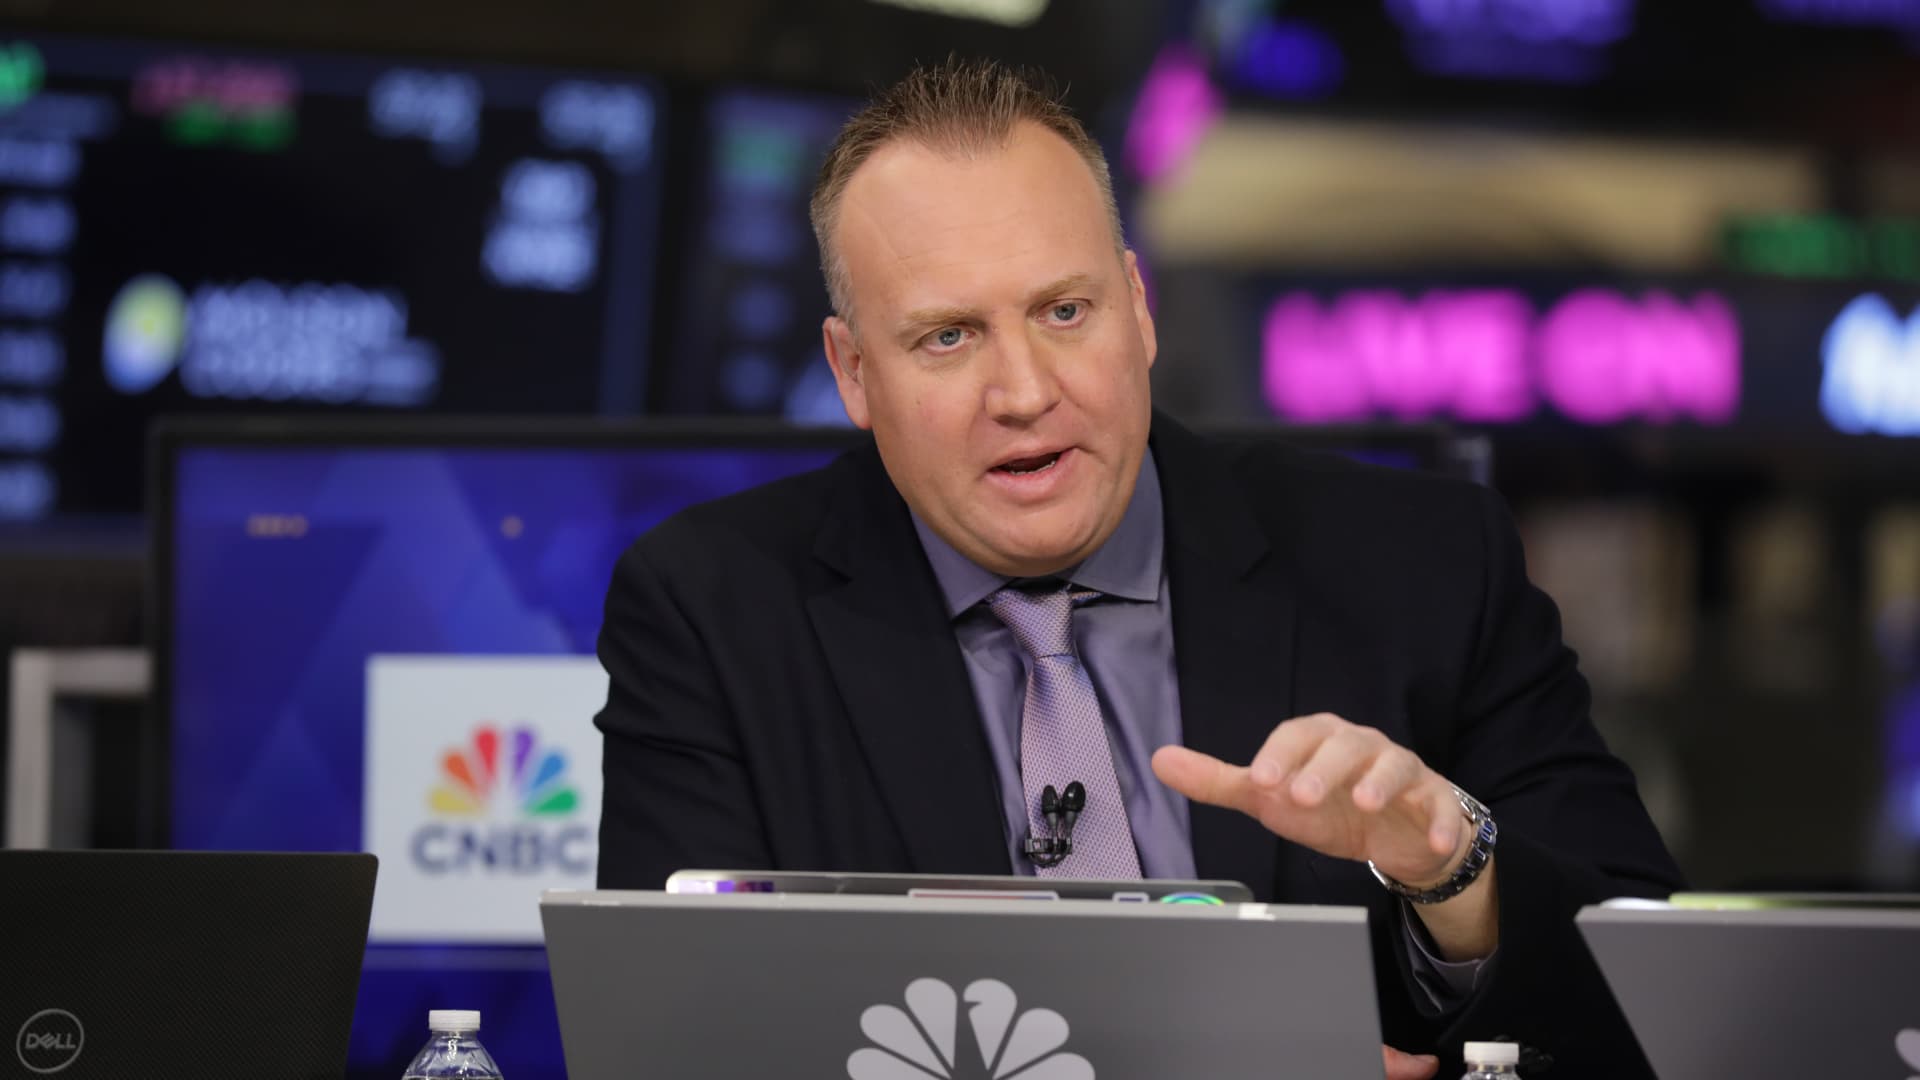
(This is The Best Stocks in the Market , brought to you by Josh Brown and Sean Russo of Ritholtz Wealth Management.) Josh — “EXTRA, EXTRA! READ ALL ABOUT IT!” This is what I’d be saying were I a newsboy on the corner of Wall & Broad circa 1925, because the people’s attention would have been warranted. But it’s 2025, so Sean and I are going to yell it from our CNBC Pro column instead. What am I carrying on about, you ask? Oh, just the fact that the health care sector of the S & P 500 just did something it hasn’t done very often over the last three decades — and when it happens, big gains are historically likely. We’ve been talking about the stealth rotation into a small group of XLV names all year here, with columns about Alnylam, Gilead , Amgen, AbbVie and more. Well, that stealth rotation ain’t so stealthy anymore, as your fellow investors have now rediscovered this formerly neglected corner of the market. They’re going up, more are joining the rally, and everybody is paying attention. Good. I can stay off the corner and leave the newsboy cap in the prop department. Now that we have your attention, let’s go a bit deeper. Here’s Sean… Sector leaderboard As of Nov 24, there are 174 names on The Best Stocks in the Market list. Top sector ranking: Top industries: Top 5 best stocks by relative strength: Sector spotlight: Health care Sean — Markets hit a rough patch last week, with several of the world’s most influential stocks dropping 20% or more. Bitcoin briefly hit the $80,000 level, while Meta Platforms broke below its 200-day moving average for the first time since April. A bout of volatility like this isn’t all bad — it forces investors to reevaluate their portfolios and gives them a real-time stress test. And despite the headlines, it’s not all doom and gloom. As CNBC’s Jim Cramer likes to remind us: There’s always a bull market somewhere. On Friday, the health care sector had some impressive stats. 21% of the XLV ended the day at a 52-week high — the highest amount of sector components we have seen do this since the summer of 2024. Here’s another big stat: 100% of the XLV sector stocks advanced on Friday. This has happened on only 34 other days going back to the inception of the XLV in December 1998. The most recent example was on April 22, and the time before that was on Oct. 13. The forward returns for are compelling after moments like this: Historically, these full-participation days have been followed by strong forward returns, with the XLV gaining an average of 4.5% over the next three months, 8.1% over six months, and 13.2% over the following year. These results are meaningfully better than all other days when the ETF does not show 100% participation, which have produced average returns of just 2.1%, 4.1%, and 8.8% over the same horizons. The hit rates reinforce the pattern as well, with full-advance days showing a 19.1% higher hit rate over three months, 15% higher over six months, and 14.7% higher over one year. In layman’s terms, this means you see higher prices over these periods more often than all other days. There are 22 names on our list from the sector. Josh will show you the best charts in a sub-sector of the XLV known as the Life Sciences Tools & Services industry group – Mettler-Toledo International (MTD) , Thermo Fisher Scientific (TMO) and Agilent (A) . Risk management Josh — Mettler-Toledo is the global leader in precision instruments and lab-to-factory measurement solutions, powering quality, compliance, and automation across pharma, biotech, food, and industrial customers worldwide. Its “Laboratory Instruments” segment serves the pharmaceutical, biotech, life-science, testing and academic markets and accounts for 56% of revenue, so it’s in the XLV as a tiny half-percent weighting. It’s a shame for the people who are merely market-weight the stock because this sucker’s running. As you can see below, Mettler took out its 52-week high with impressive momentum (RSI in bottom pane confirming the strength in the share price). And there’s an even more alluring thing happening here when we zoom out. MTD has been locked into a downtrend on this five-year chart (I’m showing you weekly closing prices) and, as of this past week, we may have finally seen it snap that downtrend once and for all. Take a look: As investors, we like that sort of action. Citi has been raising its price target on the stock all year long, and they’ve recently gone from $1,600 to $1,700, implying a gain of almost 20% from here. The bank’s analysts cited strong margins and pricing power, growth of recurring revenue and a string of recent earnings beats. I want to give this one a long enough leash and stay long with the stock above recent support at $1,300 or so. Here are two more competitors to Mettler-Toledo, all of which are on our Best Stocks list, all of which are challenging their highs from earlier in the year. These reside in the Life Sciences Tools & Services sub-industry group, just like MTD. They may all three break out at the same time. Take a look at Thermo Fisher, the largest company in the category by market cap at $220 billion. This one hasn’t punched through yet, but that golden cross in September was a good first step. I would be stalking this one and studying up on the potential fundamental catalysts. Gun to my head, it’s gonna go. Agilent (A) is slightly larger than Mettler at $42 billion in market cap. It was spun out of Hewlett-Packard in 1999 as its own publicly traded company and has returned approximately 7x to its shareholders since inception. Technically, $153 and change is the year high so not a true breakout yet but I’m ready to call it. There’s no resistance, should it get through, until around $180 per share where it traded in the summer of 2021. Agilent is a buy. Traders should obey the rising 50-day. A failed breakout is possible and that’s where you’ll want to step aside and let the name reset for a fresh attempt. Have fun out there. DISCLOSURES: (None) All opinions expressed by the CNBC Pro contributors are solely their opinions and do not reflect the opinions of CNBC, NBC UNIVERSAL, their parent company or affiliates, and may have been previously disseminated by them on television, radio, internet or another medium. THE ABOVE CONTENT IS SUBJECT TO OUR TERMS AND CONDITIONS AND PRIVACY POLICY . THIS CONTENT IS PROVIDED FOR INFORMATIONAL PURPOSES ONLY AND DOES NOT CONSITUTE FINANCIAL, INVESTMENT, TAX OR LEGAL ADVICE OR A RECOMMENDATION TO BUY ANY SECURITY OR OTHER FINANCIAL ASSET. THE CONTENT IS GENERAL IN NATURE AND DOES NOT REFLECT ANY INDIVIDUAL’S UNIQUE PERSONAL CIRCUMSTANCES. THE ABOVE CONTENT MIGHT NOT BE SUITABLE FOR YOUR PARTICULAR CIRCUMSTANCES. BEFORE MAKING ANY FINANCIAL DECISIONS, YOU SHOULD STRONGLY CONSIDER SEEKING ADVICE FROM YOUR OWN FINANCIAL OR INVESTMENT ADVISOR. INVESTING INVOLVES RISK. EXAMPLES OF ANALYSIS CONTAINED IN THIS ARTICLE ARE ONLY EXAMPLES. THE VIEWS AND OPINIONS EXPRESSED ARE THOSE OF THE CONTRIBUTORS AND DO NOT NECESSARILY REFLECT THE OFFICIAL POLICY OR POSITION OF RITHOLTZ WEALTH MANAGEMENT, LLC. JOSH BROWN IS THE CEO OF RITHOLTZ WEALTH MANAGEMENT AND MAY MAINTAIN A SECURITY POSITION IN THE SECURITIES DISCUSSED. ASSUMPTIONS MADE WITHIN THE ANALYSIS ARE NOT REFLECTIVE OF THE POSITION OF RITHOLTZ WEALTH MANAGEMENT, LLC” TO THE END OF OR OUR DISCLOSURE. Click here for the full disclaimer.


